This lesson will help you to write a successful multiple charts essay, there is a model answer for you to compare your work to at the end of the post.
Remember that your essay should have a minimum of 150 words and ideally should be completed in 20 minutes.
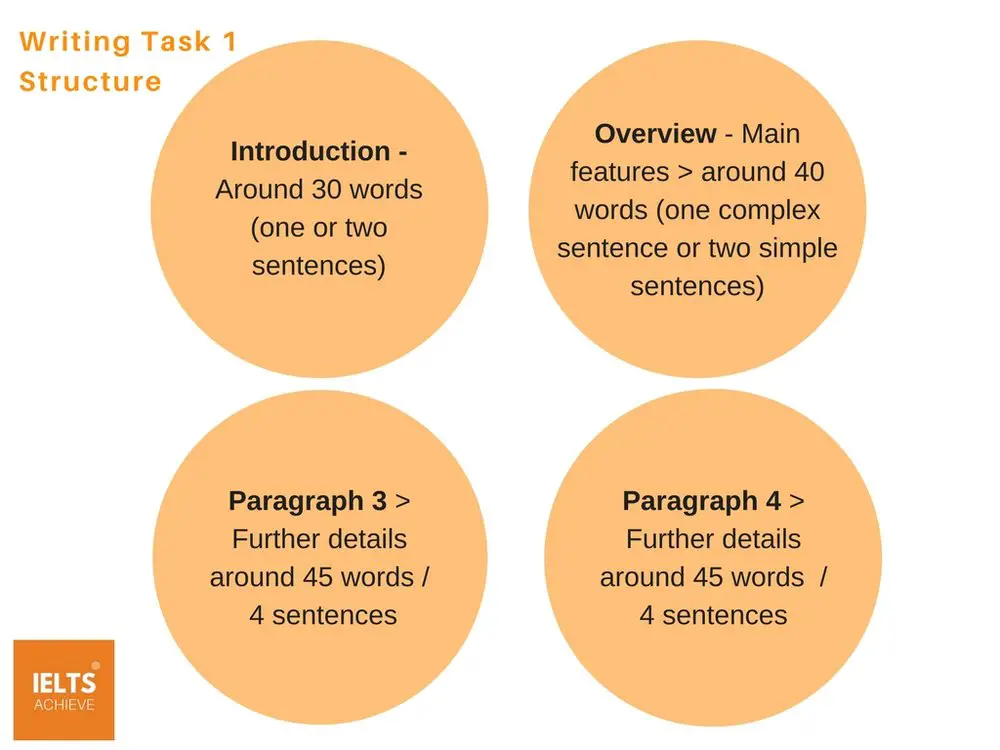
Multiple charts essay structure
The writing task 1 essay should be as follows:
Multiple charts essay Question
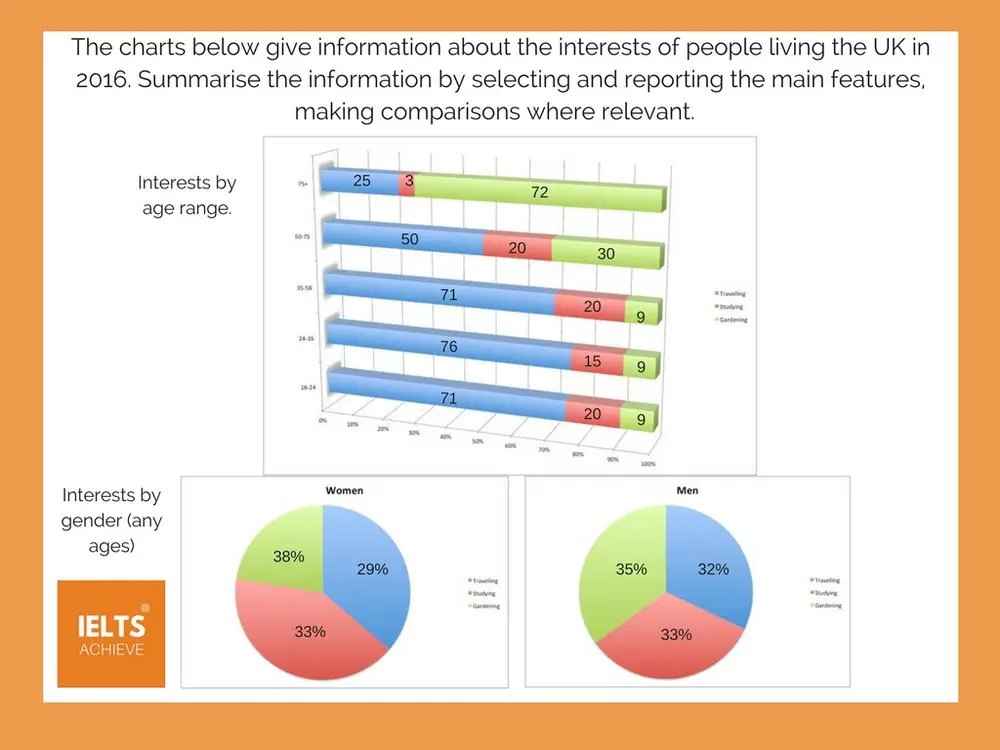
Read the question below carefully, what can you see in the information given in the chart?
Step 1 – Write the introduction
Write your own introduction of one or two sentences, paraphrasing the question, using synonyms where you can.
STEP 2 – WRITE AN OVERVIEW
Write the overview – start this paragraph with the word ‘Overall...’ and write one or two sentences which describe the main features of the information presented in the charts.
Step 2 – Write an overview
Write two main body paragraphs, going into detail and giving specific information about the charts. Remember to include data to support your findings. For example, look for the highs and lows and any major increases or decreases over time. Can you make any comparisons?
STEP 4 – CHECK YOUR WORK
When you have completed the essay, check it for any errors, spelling or grammar. Then check to see if you have included linking words that connect the information together, making it easy to read. For example, using the word ‘Overall..’ at the beginning of the overview paragraph. You can also use words like – on the one hand, on the other hand, furthermore, however, in addition, finally etc.
MODEL ANSWER
The charts both show relevant data about the interests, of people living in the UK in 2016. Moreover, the two charts represent males and females of all ages and their interests by gender, while the bar chart displays the exact level of interests according to the current age range from 16 to 75+ years.
Overall, there is a common pattern in regards to the percentage of activities between both genders and it is evidenced that there are both women and men who enjoy studying and gardening. The bar chart shows that there are high numbers of young people aged 24-50 who are interested in travelling.
On the one hand, there is a massive difference between the population who are 50-75 years old and the 75+ years regarding their interest in gardening (72%). However, the age groups with the most desire to travel in 2016 are those aged between 24-35 (76%). Furthermore, there are similar numbers of people who are interested in travelling between the age ranges of 16-24 to 35-50 (71%), which is currently expressed in the proportional bar chart.
On the other hand, there is evidence of a smaller percentage of women (29%) who want to travel compared to men (32%). People of both genders who enjoy gardening, with a contrast of 38% for women and 35% for men. Finally, both males and females are equal in their passion for studying. (33%).
(Word Count = 233 / Band Score 9)
To view more model answers for multiple charts question please click here
Writing Task 1 multiple charts model answer