This post will help you to write a successful line graph essay, there is a model answer for you to compare your work to at the end of the post.
Remember that your essay should have a minimum of 150 words and ideally should be completed in 20 minutes.
Line Graph Essay Structure
The writing task 1 essay should be as follows:

Sample Question: Line Graph
Read the question below carefully, what can you see in the information given?

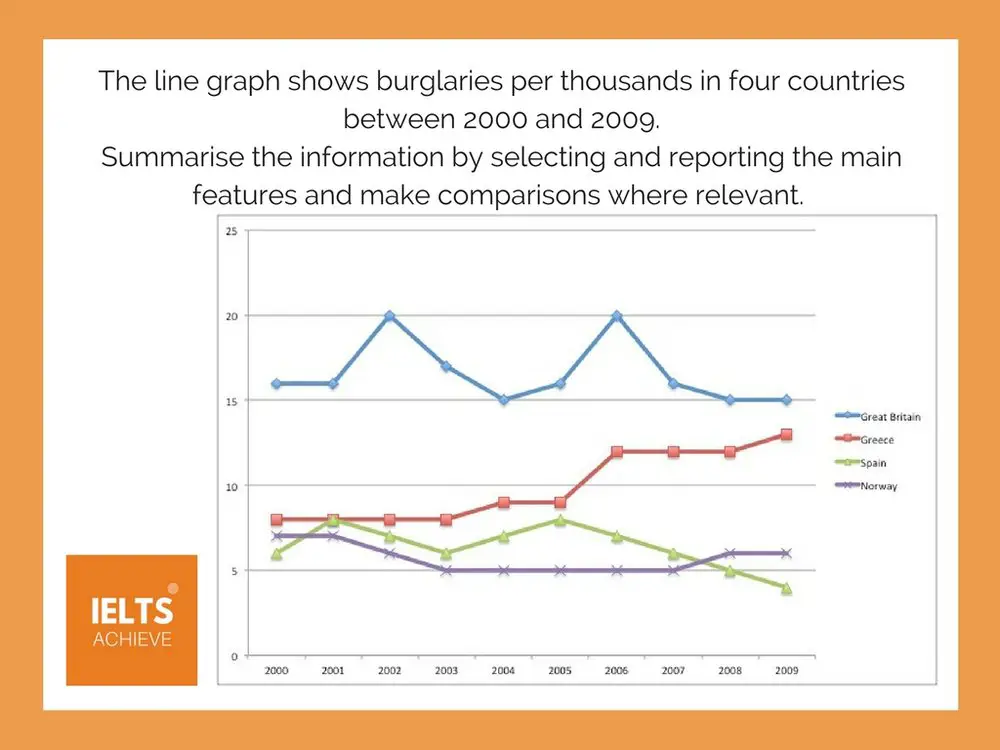
The line graph shows burglaries per thousand in four countries between 2000 and 2009.
Summarise the information by selecting and reporting the main features and make comparisons where relevant.
STEP 1 – WRITE THE INTRODUCTION
Write your own introduction of one or two sentences, paraphrasing the question, using synonyms where you can.
STEP 2 – WRITE AN OVERVIEW
Write the overview – start this paragraph with the word ‘Overall...’ and write one or two sentences which describe the main features of the information presented in the line graph.
STEP 3 – WRITE THE MAIN BODY PARAGRAPHS
Write two main body paragraphs, going into detail and giving specific information about the graph. Remember to include data to support your findings. For example, look for the highs and lows and any major increases or decreases over time.
STEP 4 – CHECK YOUR WORK
When you have completed the essay, check it for any errors, spelling or grammar. Then check to see if you have included linking words that connect the information together, making it easy to read. For example, using the word ‘Overall..’ at the beginning of the overview paragraph. You can also use words like – on the one hand, on the other hand, furthermore, however, in addition, finally etc.
Model Answer for Line graph essay
To view more model answer for similar question please click the link below:
Writing task 1 line graph model answer
The graph illustrates comparative statistics on the number of burglaries in four countries (Great Britain, Greece, Spain and Norway) over a 10-year period (2000-2009). The units of thefts were measured in thousands.
Overall, the highest recurrence of burglary was in Great Britain, which was fairly high from 2000-2009 in comparison to the other countries, while the lowest incidence when the study began in 2000 was in Spain. It can be seen that in 2009 Spain reported slightly lower figures than the other four countries.
The graph shows that Great Britain’s burglaries were consistently high, never below the 20,000 mark, though the trend fluctuates over the 10-year period. According to the data, the country experienced the highest number of thefts during 2002 (20,000) and 2006 (20,000). However, it experienced its lowest amount stolen in 2009 at approximately 15,000.
Similarly, Spain experienced fluctuating trends, but on the opposite side of the spectrum as it reported the least amount of burglaries in 2000 (6,000) with frequency varying over the years and finally reporting a decline in 2009 (4,000). However, other notable statistics are Greece’s upward trend in the number of burglaries, which started in 2000 (8,000) and finally peaked at 14,000 during 2009. Norway is also noteworthy for having considerably low thefts over the course of 10 years compared to the other countries, dropping sharply in 2003, but increasing slightly from there, finally peaking at 6,000 slightly higher than Spain.
(Word Count = 237 / Band Score 9)