In this post, we will look at a Writing Task 1 Academic bar chart essay example from the IELTS writing task 1 Academic Test. Students often ask if the questions are repeated year after year and the answer is no, but the type of chart or graph can be.
There are so many questions written each year, you may find you practice answering various questions on different topics. It is best practice to learn how to answer each one of the various types of writing task 1 questions, from bar charts, line graphs, maps, process etc.

If you would like to learn how to structure a charts and graphs essay please click the button below >
Take a look at the IELTS Writing Task 1 Academic essay example below >>
*This chart question and answer were provided by a student. IELTS Achieve did not design this bar chart question*
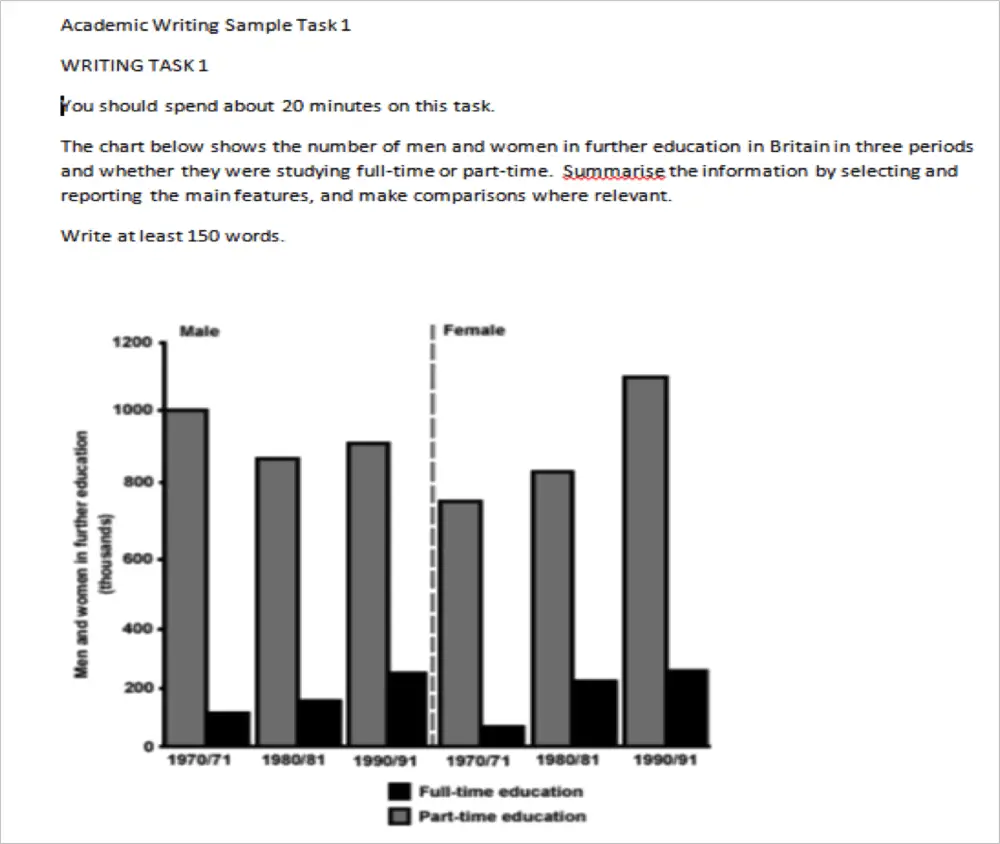
The bar chart illustrates comparative statistics on the number of males and females who underwent further education, studying in full time and in part-time education in Britain in the years; 1970-1971, 1980-1981 and 1990-1991. The number of students was measured in thousands.
Overall, part-time education had the highest number of enrollees in all three periods from both men and women while in full-time education, the highest number of students can be seen in the time period of 1990-1991 where both sexes had an equal amount of enrollees.
On the one hand, the graph shows that part-time education was consistently high, never below the 800 thousand mark in males and 600 thousand marks in females, even though the trend differs from both genders. According to the data, males had the highest part-time enrollees in 1970-1971 (1000 thousand) then the trend fluctuated and rose again over the next three year period 1980-81 (900 thousand) and 1990-91 (950 thousand), while in the female part-time enrollees they had an upward trend as the years went by with 750 thousand in 1970-71, 800 thousand students in 1980-81 and the highest peak of almost 1150 thousand students by the period of 1990-91.
On the other hand, the bar chart reveals that both genders in full-time education experienced an increasing number of students within the three time periods. Male students started at below 200 thousand in 1970-71 and rose steadily until they reached 200 thousand in 1990-91, the same can be said in the number of females enrolled, they started from 50 thousand in 1970-1971 and gradually rose as the years passed by until reaching 200 thousand female students in 1990-1991.
Word count – 274 / Band score – 8


- Task Achievement – The answer provides a paraphrased question, to begin with, followed by an overview that gives the reader key information.
- Coherence and Cohesion – The answer has been divided into clear logical paragraphs.
- Lexical Resource – There is evidence of paraphrasing, synonyms and some less common words.
- Grammatical Range and Accuracy – The answer has no grammatical errors. The sentences are mainly made up of multiple clauses and have a variety of structures.


We hope you found this post useful in helping you to study for the IELTS Test. If you have any questions please let us know in the comments below or on the Facebook page.
The best way to keep up to date with posts like this is to like us on Facebook, then follow us on Instagram and Pinterest. If you need help preparing for the IELTS Test, join the IELTS Achieve Academy and see how we can assist you to achieve your desired band score. We offer an essay correction service, mock exams and online courses.